
The Follow Spots check box causes the Map to track the positions of all filtered dxcluster spots. All lookups cause the maps to center on the location of the lookup.
Dragging the mouse over the 3D Map or pressing one of the arrow keys will cause the map to start spinning in that direction and with that velocity. The arrow keys can be modified with the Shift or the Command keys for different velocities. Press the space bar or click once on the map to stop the rotation.
Single-clicking
anywhere on the 3D Map or pressing any other key will cause the
spinning to stop.
Single clicking on a Map spot in the 2D or 3D Map will cause the call to be looked up, and the results displayed.
Double clicking on a Map spot in the 2D or 3D Map will cause the call to be looked up, the results displayed and the radio if connected, set to that frequency.
Control-single-clicking on the 3D Map will reset the camera to be over the last spot or lookup.
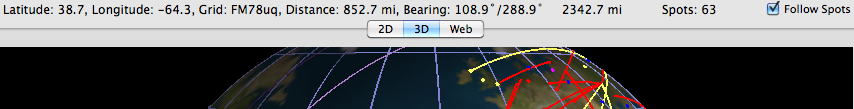
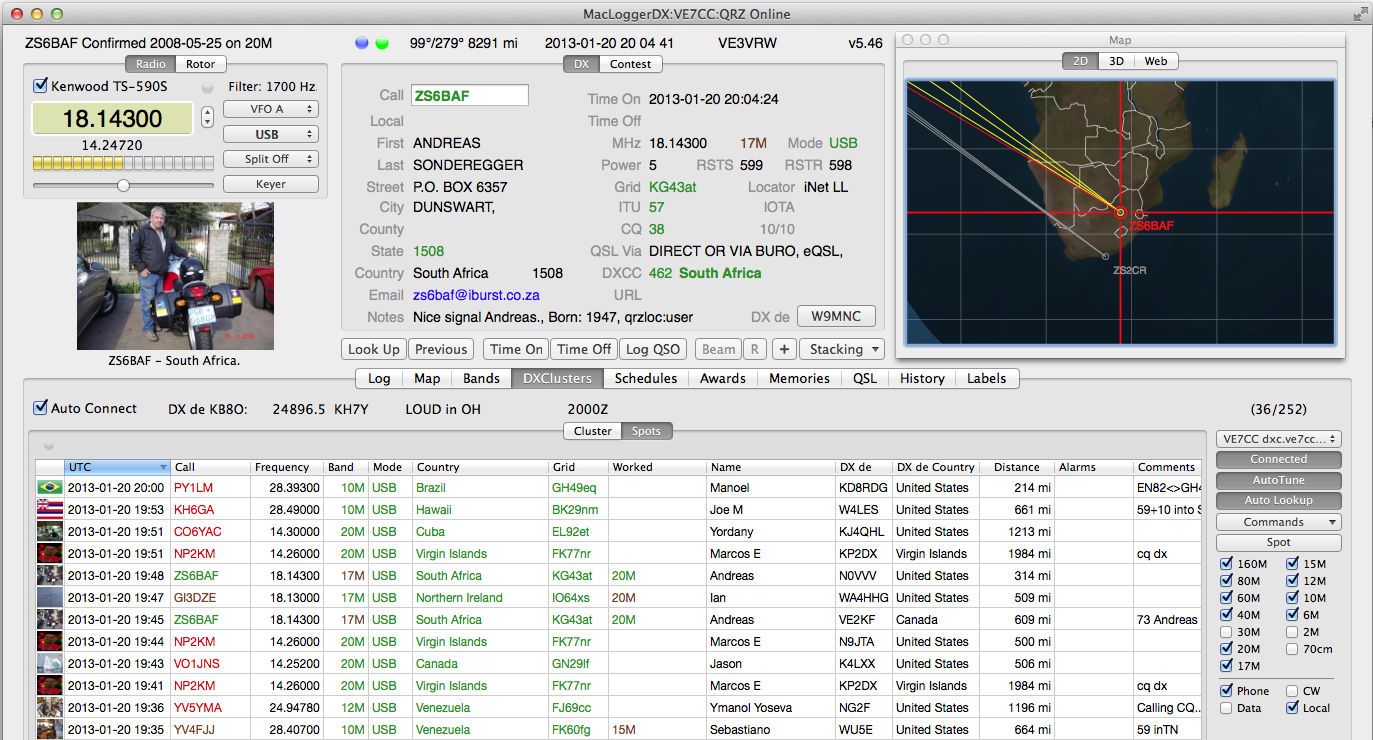
If you mouse over a DX spot or Log spot on the 2D or 3D Maps the information for that spot will be displayed in the status area above the map image.
![]()
The Locator field in the DX and Contest Panels will tell you what Geolocation method MacLoggerDX has used for each lookup:
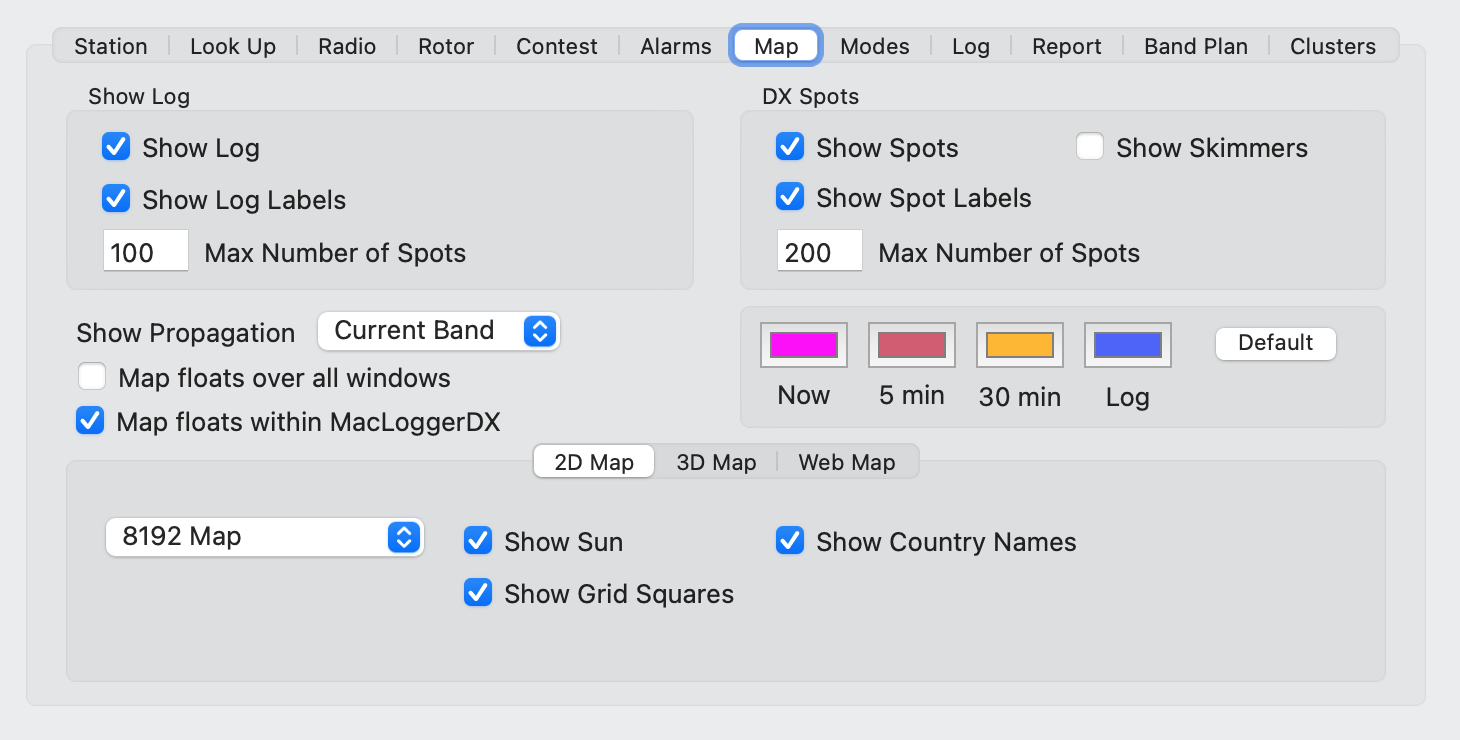
Enable the DX Spots/Show Spots check boxes and enter the total number of spots you want to display in the Max Number of Spots field.
Enable the Show Log and Show Log Labels check boxes and enter the total number of logged QSO's you want to display in the Max Number of Spots field.
The log spots displayed are also affected by the search criteria you have set in the log panel.
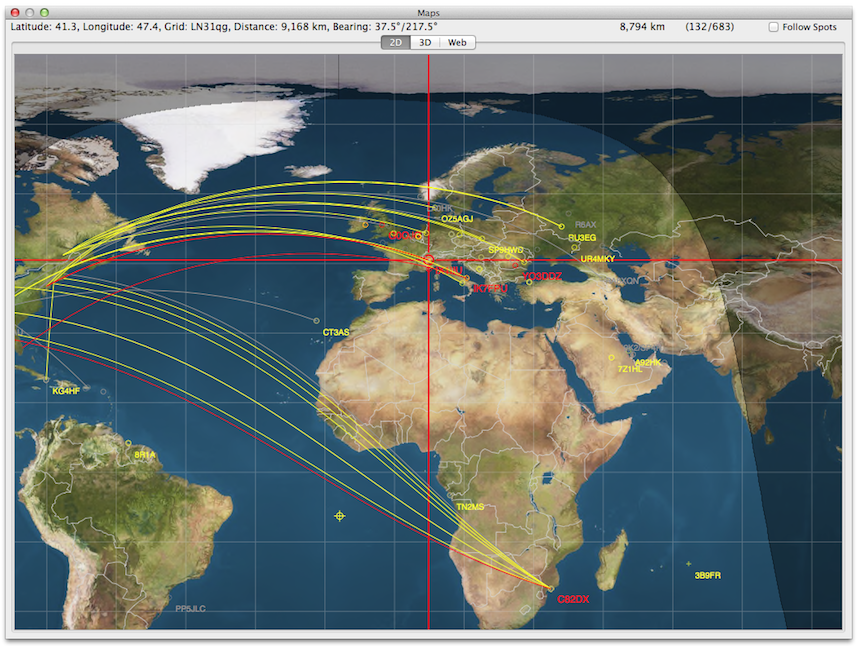
The Show Propgation popup shows the current propagation by band based on DX Cluster reported spots by drawing a time color coded line between the spot and the reporting station. This will allow you to use the 2D or 3D maps to see the real-time propagation paths that are being reported on the DX clusters for any single band, all bands or the current band your radio is set to.
In both maps a time color coded line is drawn between the reporting station and the reported spot thus giving you a visual representation of what the current propagation looks like for any band.
Propagation lines are only calculated for DX Cluster spots. If the spot poster has included his grid square in the spot post then the center of that grid square will be used as the geolocation for one end of the propagation line even though it is only a four character grid square, lacking in precision since it was entered by the reporting station and should in most cases be accurate. If there is no reporting location in the DX Cluster spot MacLoggerDX looks up the reporting call to obtain a geolocation. In both cases - reporting and reported spot - the accuracy of the locations depends on which call book option you are using.
Spots on 2D & 3D Map and Bands Panel:
2D Map Marker Shapes:
The Resolution popup sets the 2D Map resolution to be displayed. You can also control-click on the map and select Zoom In or Zoom Out from the contextual menu. Adjust the map resolution so that the map is larger than the window and MacLoggerDX will automatically scroll to the spotted station.
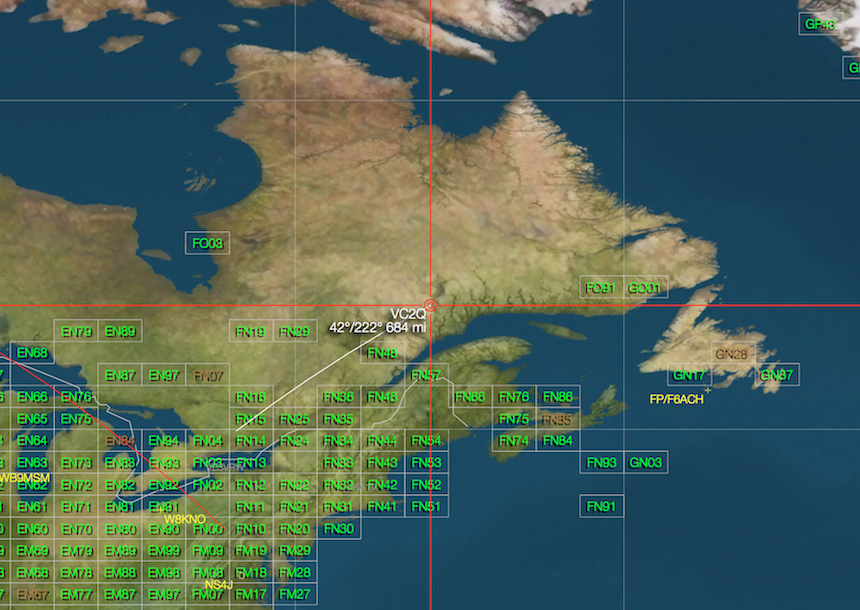
The Show Grid Squares check box will display worked/confirmed grid squares based on the Awards VUCC panel search criteria. If you un-check the VUCC Only check box then all worked/confirmed Grids will be displayed.

The Ambient Light slider sets the background illumination for the 3D Map.
The Camera Distance slider sets the distance of the camera from the center of the Earth. You can also control-click on the map and use the slider to Zoom In or Zoom Out from the contextual menu.
The
Resolution popup sets the 3D Map resolution to be displayed.
The Font Scale popup allows you to override the Default screen backing scale factor if you are seeing 3D label clipping.

The
Zoom Level slider sets the distance of the
camera above the map.
The Static Map check box selects the faster Google Static Maps instead of the zoomable Embedded Maps. (Google limits the total number of Static Maps to 25,000 map loads per 24 hours - if that limit is exceeded you may see a g.co/staticmaperror/signature error and you will need to switch to Embedded Maps).
The Map Style popup allows you to choose from Map, Satellite Imagery, Hybrid and Terrain Data Maps.
Floating Maps Window
Select Detach Map Window from the Map Menu to display the Maps in a separate window.
Attach Map Window will return the Maps to the Map Panel.
The Map floats over all windows Map Prefs check box forces the detached Map window to float over all other application windows.
The Map floats within MacLoggerDX Map Prefs check box forces the detached Map window to float over all of MacLoggerDX's windows.
The Bearing Menu item under the MacLoggerDX Menu activates a Bearing Display HUD which will display the lookup bearing (white) as well as the actual rotor bearing (green) if your rotor controller supports read-back. The rotor read-back bearing (if available) will also display as a green line on the 2D and 3D maps.
Rotor Controllers supporting read-back:
